

Inline Dashboard
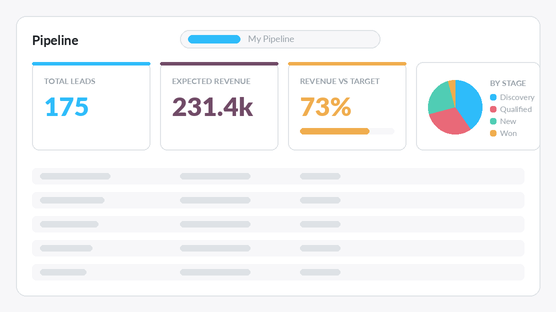
A strip of KPI tiles right above any list or kanban view — numbers, progress, pie, bar and trend — that follow the filters your users already apply.
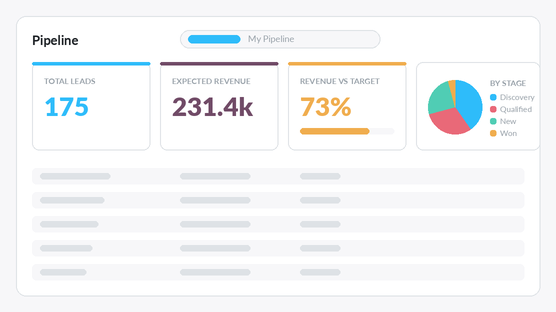
The numbers live where the work is
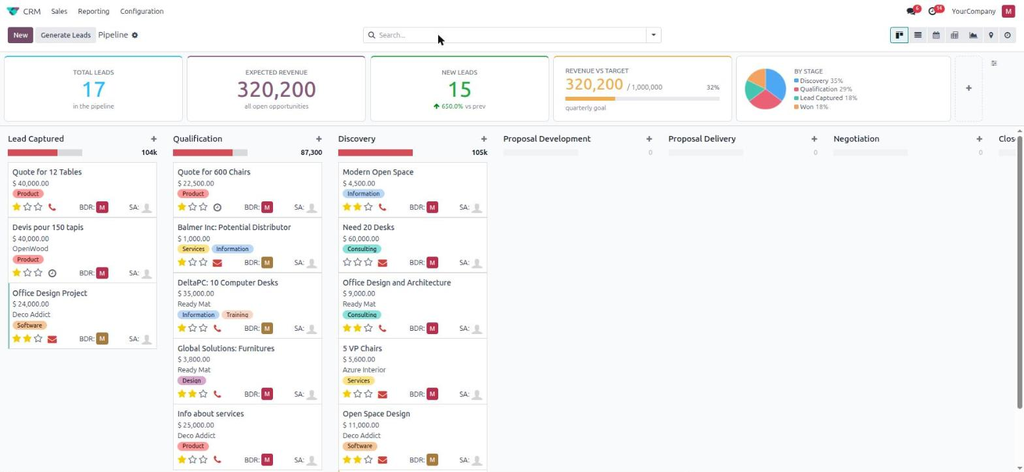
A dashboard is usually a separate screen, so people stop looking at it. This module puts the figures on the screen they already work on: under the control panel of the pipeline, of the task list, of the stock moves. One dashboard per screen, configured once by an administrator, seen by everybody who opens it — or one built for a single named person, which only they see.
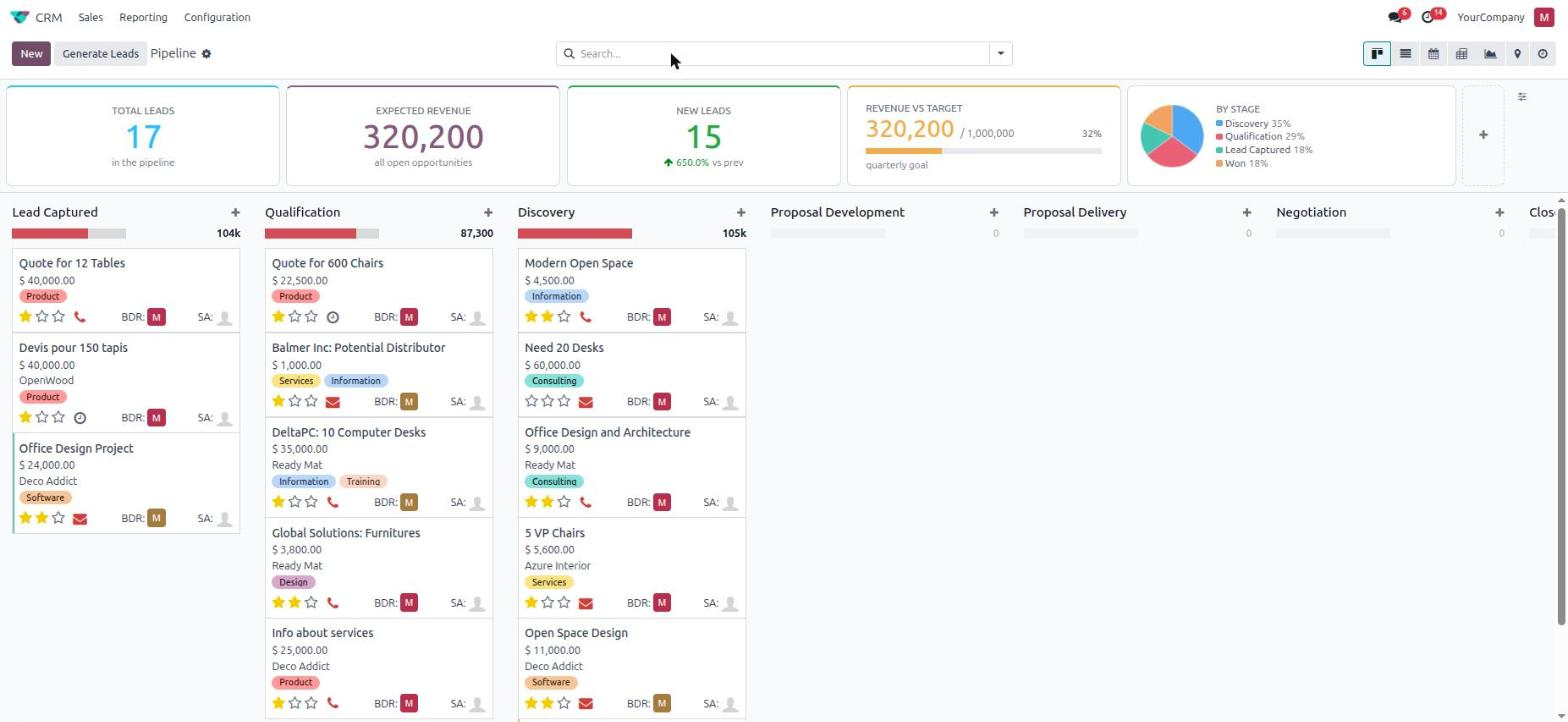
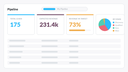
The whole pipeline, and the figures that describe it, on one screen.
They answer to the search bar
Every filter, facet and saved favourite the user applies is combined into each tile's own domain. Switch to My Pipeline and the total drops to yours. Filter on a team, a period, a country, and the pie redraws with it. The tiles always describe what is on screen — which is what makes them worth glancing at.

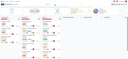
The same tiles under a My Pipeline filter — 17 opportunities become 10, and every tile follows.
- The live search domain is applied to every tile built on the screen's own model.
- A tile built on another model keeps its own figure and simply ignores the filters.
- Values are aggregated with the reading user's access rights — no tile leaks a record.
Five widgets
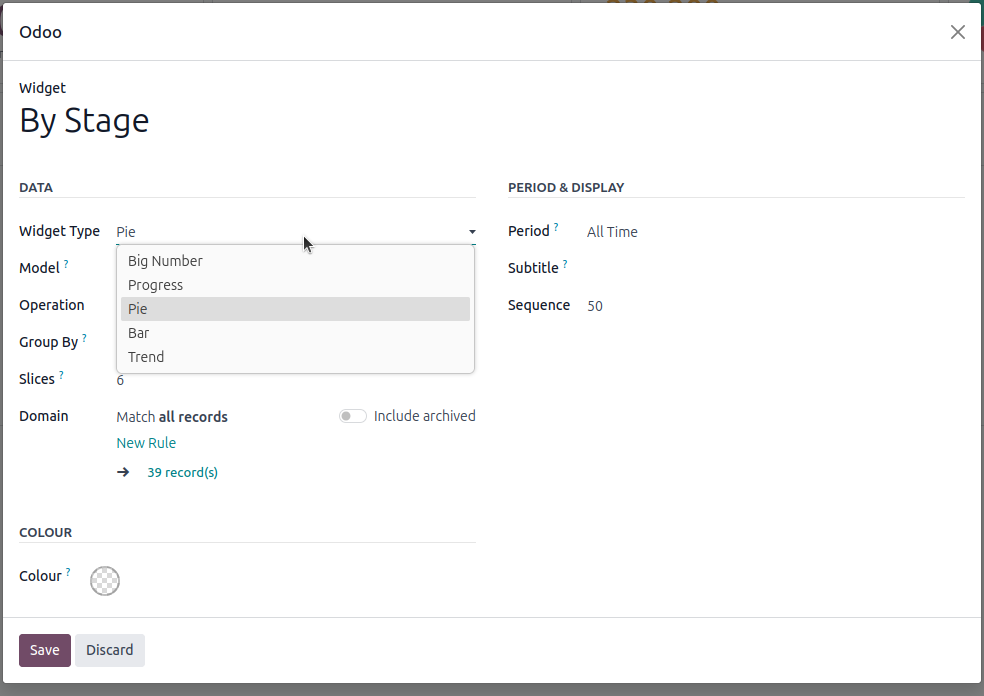
- Big Number — one figure, with an optional vs previous period delta.
- Progress — the same figure read against a target, with a filled bar.
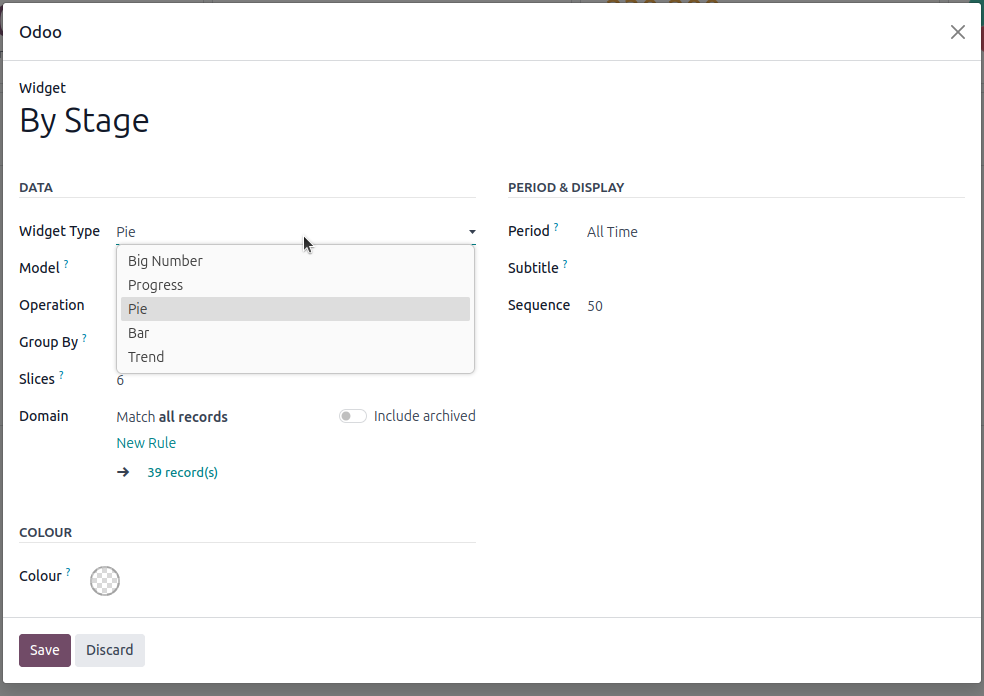
- Pie — the figure split over any field, with the share of each slice.
- Bar — the same split, ranked.
- Trend — one point per day, week, month, quarter or year.
All five count, sum or average any stored field. Pie and bar keep the biggest groups and fold the tail into a single Others, so grouping on a field with hundreds of values still gives a chart you can read.
Configured from the screen itself
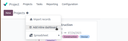
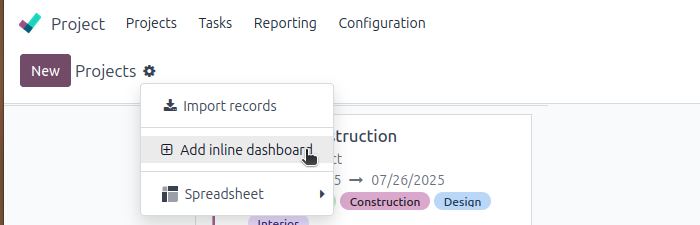
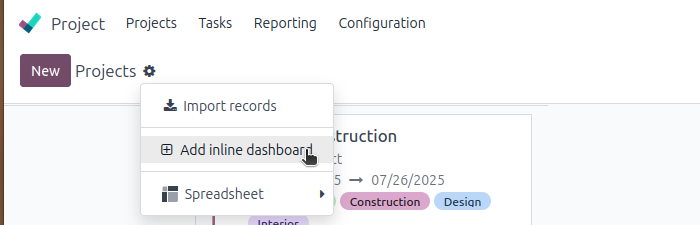
Open the list or kanban you want the figures on, use the gear menu > Add shared inline dashboard, then + to add a tile. The model is already filled in, the domain has the usual Odoo domain editor, and the tile appears as soon as you save. No view has to be inherited and no developer has to be involved.
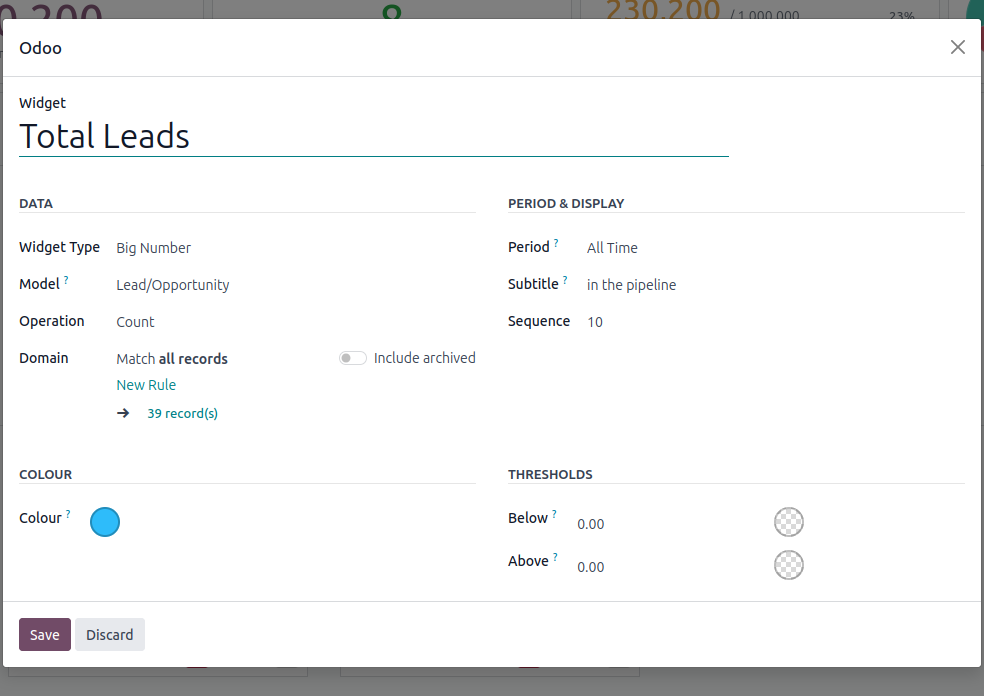
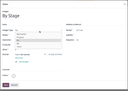
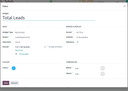
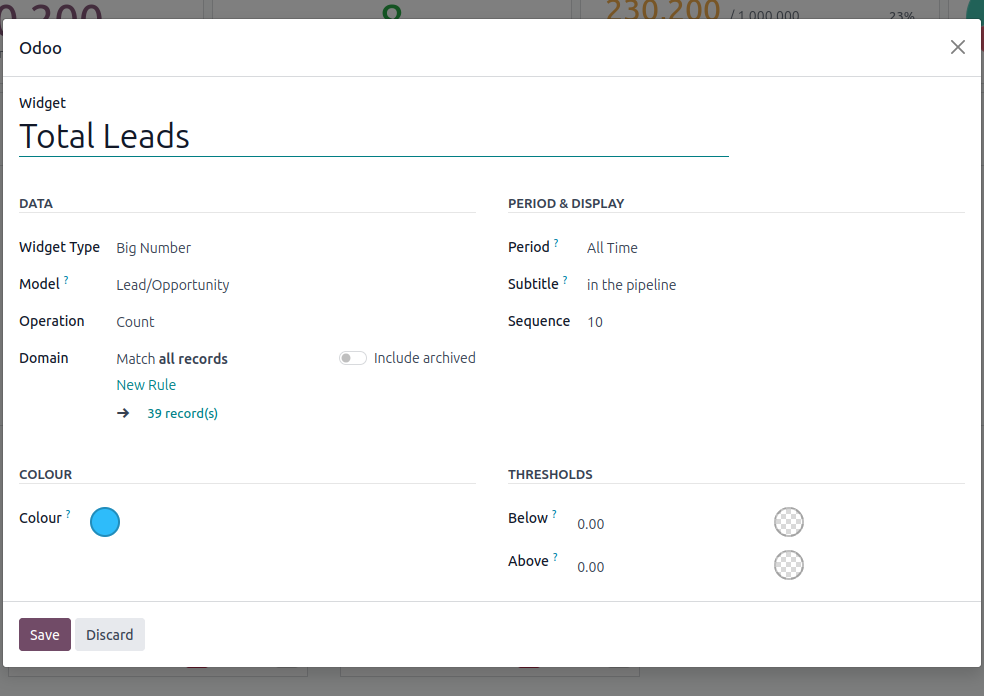
One widget: what to measure, over which period, and the colours it takes.
Shared for the team, personal for one person
The dashboard of a screen is normally shared: everybody who opens that list or kanban sees the same tiles. Some people need something else on the same screen — the head of a team wants the queue waiting on them, not the company total.
So a dashboard can instead be personal: pick the screen and the user it belongs to, and that person sees their own tiles there while everybody else keeps the shared strip. One personal dashboard per person per screen, and it replaces the shared one rather than adding to it, so nobody ends up with two rows of figures.
Both kinds live in one place — Dashboards > Configuration > Inline Dashboards — where the Dashboard administrator sees every dashboard in the database, who each one is for, and how many tiles it carries. Personal dashboards are created there, since that is where the user is chosen. A user never sees anybody else's: it is enforced by record rules, not merely hidden on screen.
Periods, comparisons and colours
Point a tile at a date field and pick a period, and it counts only the running day, week, month, quarter or year. Tick compare vs previous period and it also shows how it moved — ▲ 12% or ▼ 4% against the same window one period back.
Give a tile two thresholds and it changes colour on its own: green while the figure is where you want it, red once it drops under the line. The colour paints both the number and the top edge of the tile, so a strip of ten tiles is readable at a glance.
Every list and kanban view
CRM, Sales, Purchase, Inventory, Projects, Recruitment, Helpdesk, Accounting — and the views of your own modules. The strip is attached to the action, so the same screen shows the same figures to everyone, and a screen without a dashboard costs nothing: the client learns once per session which actions have one and stays silent for the rest.
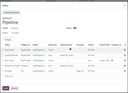
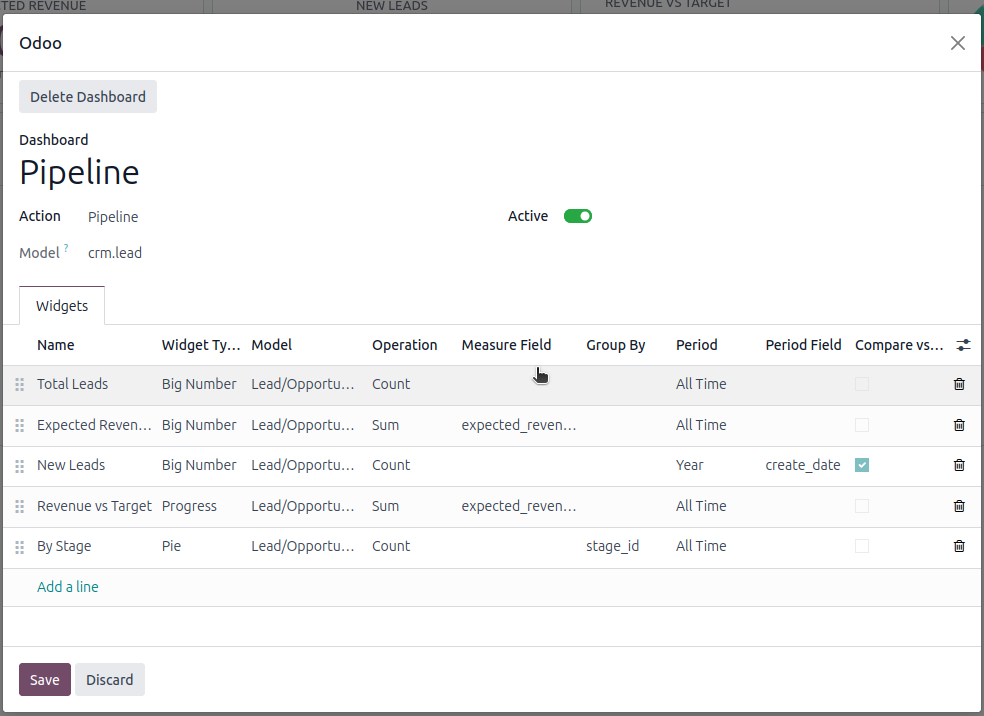
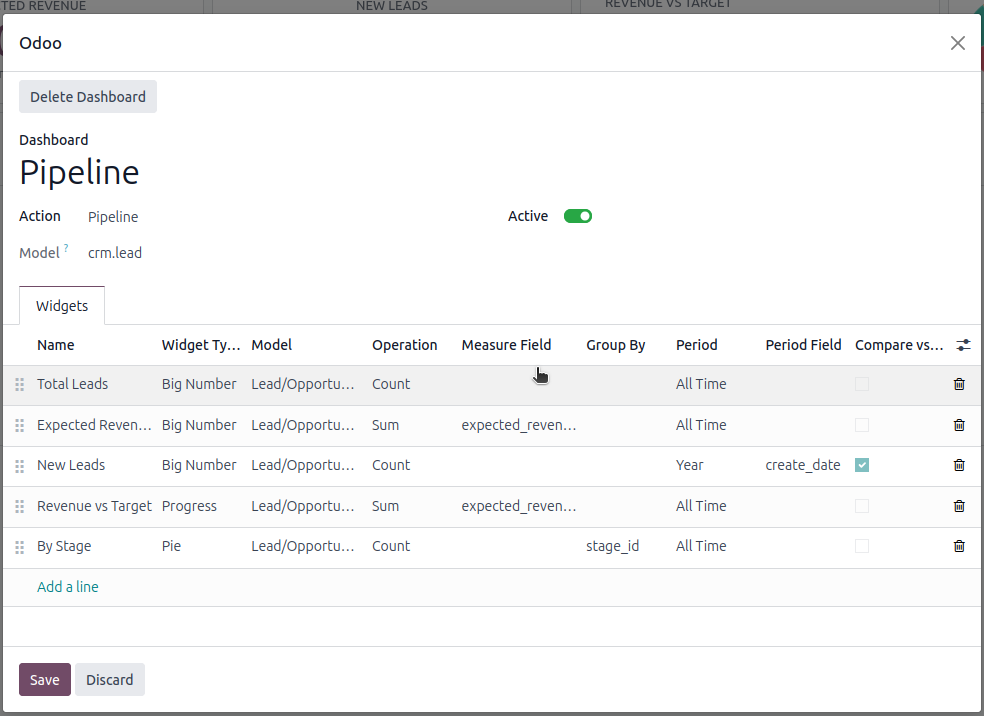
A whole dashboard is also editable in one place: every tile of one screen as a list, reorderable by drag.
Technical notes
- Two models are added,
inline.dashboardandinline.dashboard.item. No existing model is modified. - Aggregation runs through the ORM as the current user, so record rules and access rights apply.
- A personal dashboard is readable only by the person it belongs to and by the Dashboard administrator — enforced by record rules on both models, not by hiding it on screen.
- One shared dashboard per screen, and at most one personal dashboard per person per screen, guaranteed by a unique index rather than by application code alone.
- A widget that cannot be computed shows its error on its own tile and never breaks the rest of the strip.
- Charts use the Chart.js already shipped with Odoo — no library is bundled.
- No data is collected, sent anywhere, or stored outside your database.
- No activation key, no external service, no license check.
- Depends on
webandspreadsheet_dashboard(for the Dashboard administrator group).
Support
Written and maintained by Svyatoslav Nadozirny. Questions, bug reports and feature requests are welcome — answered directly by the author.
Technical details
| Technical name | inline_dashboard |
|---|---|
| Odoo versions | 20.0, 19.0, 18.0, 17.0 |
| License | OPL-1 |
| Required Odoo apps | spreadsheet_dashboard, web |